
状态:原创 / 转载(请表明来源)
实验目的
测试 ShardingSphere-Proxy 透传 MySQL 的损耗
-
测试 sysbench 直接压测 MySQL 性能
-
测试 sysbench 压测 ShardingSphere-Proxy(底层透传 MySQL)
基于以上两组实验,得到使用 ShardingSphere-Proxy 对于 MySQL 的损耗
环境信息
服务器信息
| 系统 | CPU | 内存 | 磁盘 | 实例类型 | JDK |
|---|---|---|---|---|---|
| CentOS 7.1.1503 | 32C | 64G | 1T SSD | c6.8xlarge.2 | 1.8.0_131 |
实验组网
| 角色 | 服务 | IP | 端口 | 版本 |
|---|---|---|---|---|
| DB | MySQL | 10.16.9.* | 3306 | 5.7.20 |
| 发压机 | sysbench | 10.16.9.* | \ | 1.0.20 |
| 中间件 | ShardingSphere-Proxy | 10.16.9.* | 3333 | 5.1.1 |
DB 信息
DB Version 5.7.26
参数配置
my.cnf
[mysqld]
server_id=13306
port =3306
basedir=/usr/local/mysql5.7
datadir=/data/mysql/mysql3306/data
log-error=/data/mysql/mysql3306/data/mysql.err
character_set_server = utf8mb4
pid-file=/data/mysql/mysql3306/data/mysql.pid
socket=/tmp/mysql3306.sock
max_connections=50000
innodb_buffer_pool_size=16000000000
innodb-log-file-size=3000000000
innodb-log-files-in-group=5
innodb-flush-log-at-trx-commit=0
innodb-change-buffer-max-size=40
back_log=900
#innodb_io_capacity
#innodb_io_capacity_max
innodb_max_dirty_pages_pct=75
innodb_open_files=20480
innodb_buffer_pool_instances=8
innodb_page_cleaners=8
innodb_purge_threads=2
innodb_read_io_threads=8
innodb_write_io_threads=8
table_open_cache=102400
log_timestamps=system
thread_cache_size=16384
transaction_isolation=READ-COMMITTED
压测工具信息
Sysbench 版本 1.0.20
中间件
ShardingSphere-Proxy 5.1.1
验证过程
准备实验环境
通过 sysbench 向 MySQL 灌入 10表(单表 1,000,000 行)
sysbench oltp_read_write --mysql-host='127.0.0.1' --mysql-port=3306 --mysql-user=${USER} --mysql-password='${PASSWD}' --mysql-db=test --tables=10 --table-size=1000000 --report-interval=10 --time=100 --threads=100 prepare
构建 ShardingSphere-Proxy
- 编辑 conf/server.yaml
cat apache-shardingsphere-5.1.1-shardingsphere-proxy-bin/conf/server.yaml | grep -v ^# | grep -v ^$
rules:
  - !AUTHORITY
    users:
      - root@%:root
    provider:
      type: ALL_PRIVILEGES_PERMITTED
props:
- 启动 Proxy ,创建逻辑库,使用 DistSQL 动态添加 DataSource
MySQL [(none)]> create database test;
Query OK, 0 rows affected (1.33 sec)

MySQL [(none)]> use test;
Database changed
MySQL [test]> ADD RESOURCE test (
    -> URL="jdbc:mysql://10.16.9.*:3306/test?useSSL=false&useUnicode=true&characterEncoding=UTF-8",
    -> USER=${USER},
    -> PASSWORD=${PASSWD},
    -> PROPERTIES("maximumPoolSize"=300,"idleTimeout"="30000")
    -> );

 // maximumPoolSize 设置大于要压测的线程
开启压测
直压 DB
sysbench oltp_read_write --mysql-host='10.16.9.*' --mysql-port=3306 --mysql-user=${USER} --mysql-password=${PASSWD} --mysql-db=test --tables=10 --table-size=1000000 --report-interval=10 --time=120 --threads=200 run
压测 Proxy
sysbench oltp_read_write --mysql-host='10.16.9.*' --mysql-port=3333 --mysql-user=${USER} --mysql-password=${PASSWD} --mysql-db=test --tables=10 --table-size=1000000 --report-interval=10 --time=120 --threads=200 run
测试结果
直压 DB
sysbench 1.0.20 (using bundled LuaJIT 2.1.0-beta2)

Running the test with following options:
Number of threads: 200
Report intermediate results every 10 second(s)
Initializing random number generator from current time


Initializing worker threads...

Threads started!

[ 10s ] thds: 200 tps: 11161.70 qps: 223453.06 (r/w/o: 156451.76/44658.51/22342.80) lat (ms,95%): 27.17 err/s: 0.00 reconn/s: 0.00
[ 20s ] thds: 200 tps: 11633.36 qps: 232671.02 (r/w/o: 162868.95/46535.14/23266.92) lat (ms,95%): 25.28 err/s: 0.00 reconn/s: 0.00
[ 30s ] thds: 200 tps: 11687.37 qps: 233740.48 (r/w/o: 163616.94/46749.60/23373.95) lat (ms,95%): 24.38 err/s: 0.00 reconn/s: 0.00
[ 40s ] thds: 200 tps: 11713.81 qps: 234291.11 (r/w/o: 164009.58/46853.42/23428.11) lat (ms,95%): 24.38 err/s: 0.00 reconn/s: 0.00
[ 50s ] thds: 200 tps: 11684.26 qps: 233670.98 (r/w/o: 163565.00/46737.66/23368.33) lat (ms,95%): 24.38 err/s: 0.00 reconn/s: 0.00
[ 60s ] thds: 200 tps: 11688.16 qps: 233760.07 (r/w/o: 163634.52/46749.43/23376.12) lat (ms,95%): 24.38 err/s: 0.00 reconn/s: 0.00
[ 70s ] thds: 200 tps: 11624.07 qps: 232475.59 (r/w/o: 162729.74/46497.60/23248.25) lat (ms,95%): 24.83 err/s: 0.00 reconn/s: 0.00
[ 80s ] thds: 200 tps: 11674.39 qps: 233495.74 (r/w/o: 163450.12/46696.95/23348.67) lat (ms,95%): 24.38 err/s: 0.00 reconn/s: 0.00
[ 90s ] thds: 200 tps: 11662.02 qps: 233235.44 (r/w/o: 163264.11/46646.59/23324.74) lat (ms,95%): 24.83 err/s: 0.00 reconn/s: 0.00
[ 100s ] thds: 200 tps: 11707.32 qps: 234137.65 (r/w/o: 163893.62/46830.29/23413.75) lat (ms,95%): 24.38 err/s: 0.00 reconn/s: 0.00
[ 110s ] thds: 200 tps: 11727.58 qps: 234547.54 (r/w/o: 164181.68/46910.91/23454.95) lat (ms,95%): 24.38 err/s: 0.00 reconn/s: 0.00
[ 120s ] thds: 200 tps: 11731.00 qps: 234638.36 (r/w/o: 164251.67/46924.69/23462.00) lat (ms,95%): 24.38 err/s: 0.00 reconn/s: 0.00
SQL statistics:
    queries performed:
        read:                            19560590
        write:                           5588740
        other:                           2794370
        total:                           27943700
    transactions:                        1397185 (11638.59 per sec.)
    queries:                             27943700 (232771.76 per sec.)
    ignored errors:                      0      (0.00 per sec.)
    reconnects:                          0      (0.00 per sec.)

General statistics:
    total time:                          120.0463s
    total number of events:              1397185

Latency (ms):
         min:                                    5.37
         avg:                                   17.18
         max:                                  109.75
         95th percentile:                       24.83
         sum:                             23999546.19

Threads fairness:
    events (avg/stddev):           6985.9250/34.74
    execution time (avg/stddev):   119.9977/0.01
压测 Proxy
sysbench 1.0.20 (using bundled LuaJIT 2.1.0-beta2)

Running the test with following options:
Number of threads: 200
Report intermediate results every 10 second(s)
Initializing random number generator from current time


Initializing worker threads...

Threads started!

[ 10s ] thds: 200 tps: 5562.10 qps: 111437.76 (r/w/o: 78035.99/22257.88/11143.89) lat (ms,95%): 62.19 err/s: 0.00 reconn/s: 0.00
[ 20s ] thds: 200 tps: 7030.31 qps: 140625.40 (r/w/o: 98441.81/28122.76/14060.83) lat (ms,95%): 38.25 err/s: 0.00 reconn/s: 0.00
[ 30s ] thds: 200 tps: 7029.75 qps: 140570.44 (r/w/o: 98395.23/28115.91/14059.30) lat (ms,95%): 38.25 err/s: 0.00 reconn/s: 0.00
[ 40s ] thds: 200 tps: 6646.24 qps: 132943.07 (r/w/o: 93065.31/26586.27/13291.49) lat (ms,95%): 40.37 err/s: 0.00 reconn/s: 0.00
[ 50s ] thds: 200 tps: 6938.79 qps: 138806.98 (r/w/o: 97172.32/27755.88/13878.79) lat (ms,95%): 39.65 err/s: 0.00 reconn/s: 0.00
[ 60s ] thds: 200 tps: 6878.76 qps: 137544.84 (r/w/o: 96271.67/27515.75/13757.42) lat (ms,95%): 39.65 err/s: 0.00 reconn/s: 0.00
[ 70s ] thds: 200 tps: 6650.90 qps: 133010.72 (r/w/o: 93105.12/26604.20/13301.40) lat (ms,95%): 41.10 err/s: 0.00 reconn/s: 0.00
[ 80s ] thds: 200 tps: 6581.79 qps: 131627.58 (r/w/o: 92137.31/26326.28/13163.99) lat (ms,95%): 41.10 err/s: 0.00 reconn/s: 0.00
[ 90s ] thds: 200 tps: 6973.79 qps: 139482.63 (r/w/o: 97637.91/27897.55/13947.17) lat (ms,95%): 38.94 err/s: 0.00 reconn/s: 0.00
[ 100s ] thds: 200 tps: 6876.19 qps: 137524.99 (r/w/o: 96269.85/27502.66/13752.48) lat (ms,95%): 39.65 err/s: 0.00 reconn/s: 0.00
[ 110s ] thds: 200 tps: 6712.45 qps: 134233.97 (r/w/o: 93962.18/26847.29/13424.50) lat (ms,95%): 40.37 err/s: 0.00 reconn/s: 0.00
[ 120s ] thds: 200 tps: 6893.77 qps: 137892.90 (r/w/o: 96527.68/27577.78/13787.44) lat (ms,95%): 39.65 err/s: 0.00 reconn/s: 0.00
SQL statistics:
    queries performed:
        read:                            11311412
        write:                           3231832
        other:                           1615916
        total:                           16159160
    transactions:                        807958 (6729.61 per sec.)
    queries:                             16159160 (134592.22 per sec.)
    ignored errors:                      0      (0.00 per sec.)
    reconnects:                          0      (0.00 per sec.)

General statistics:
    total time:                          120.0588s
    total number of events:              807958

Latency (ms):
         min:                                   15.91
         avg:                                   29.71
         max:                                  808.63
         95th percentile:                       40.37
         sum:                             24004177.98

Threads fairness:
    events (avg/stddev):           4039.7900/39.39
    execution time (avg/stddev):   120.0209/0.02
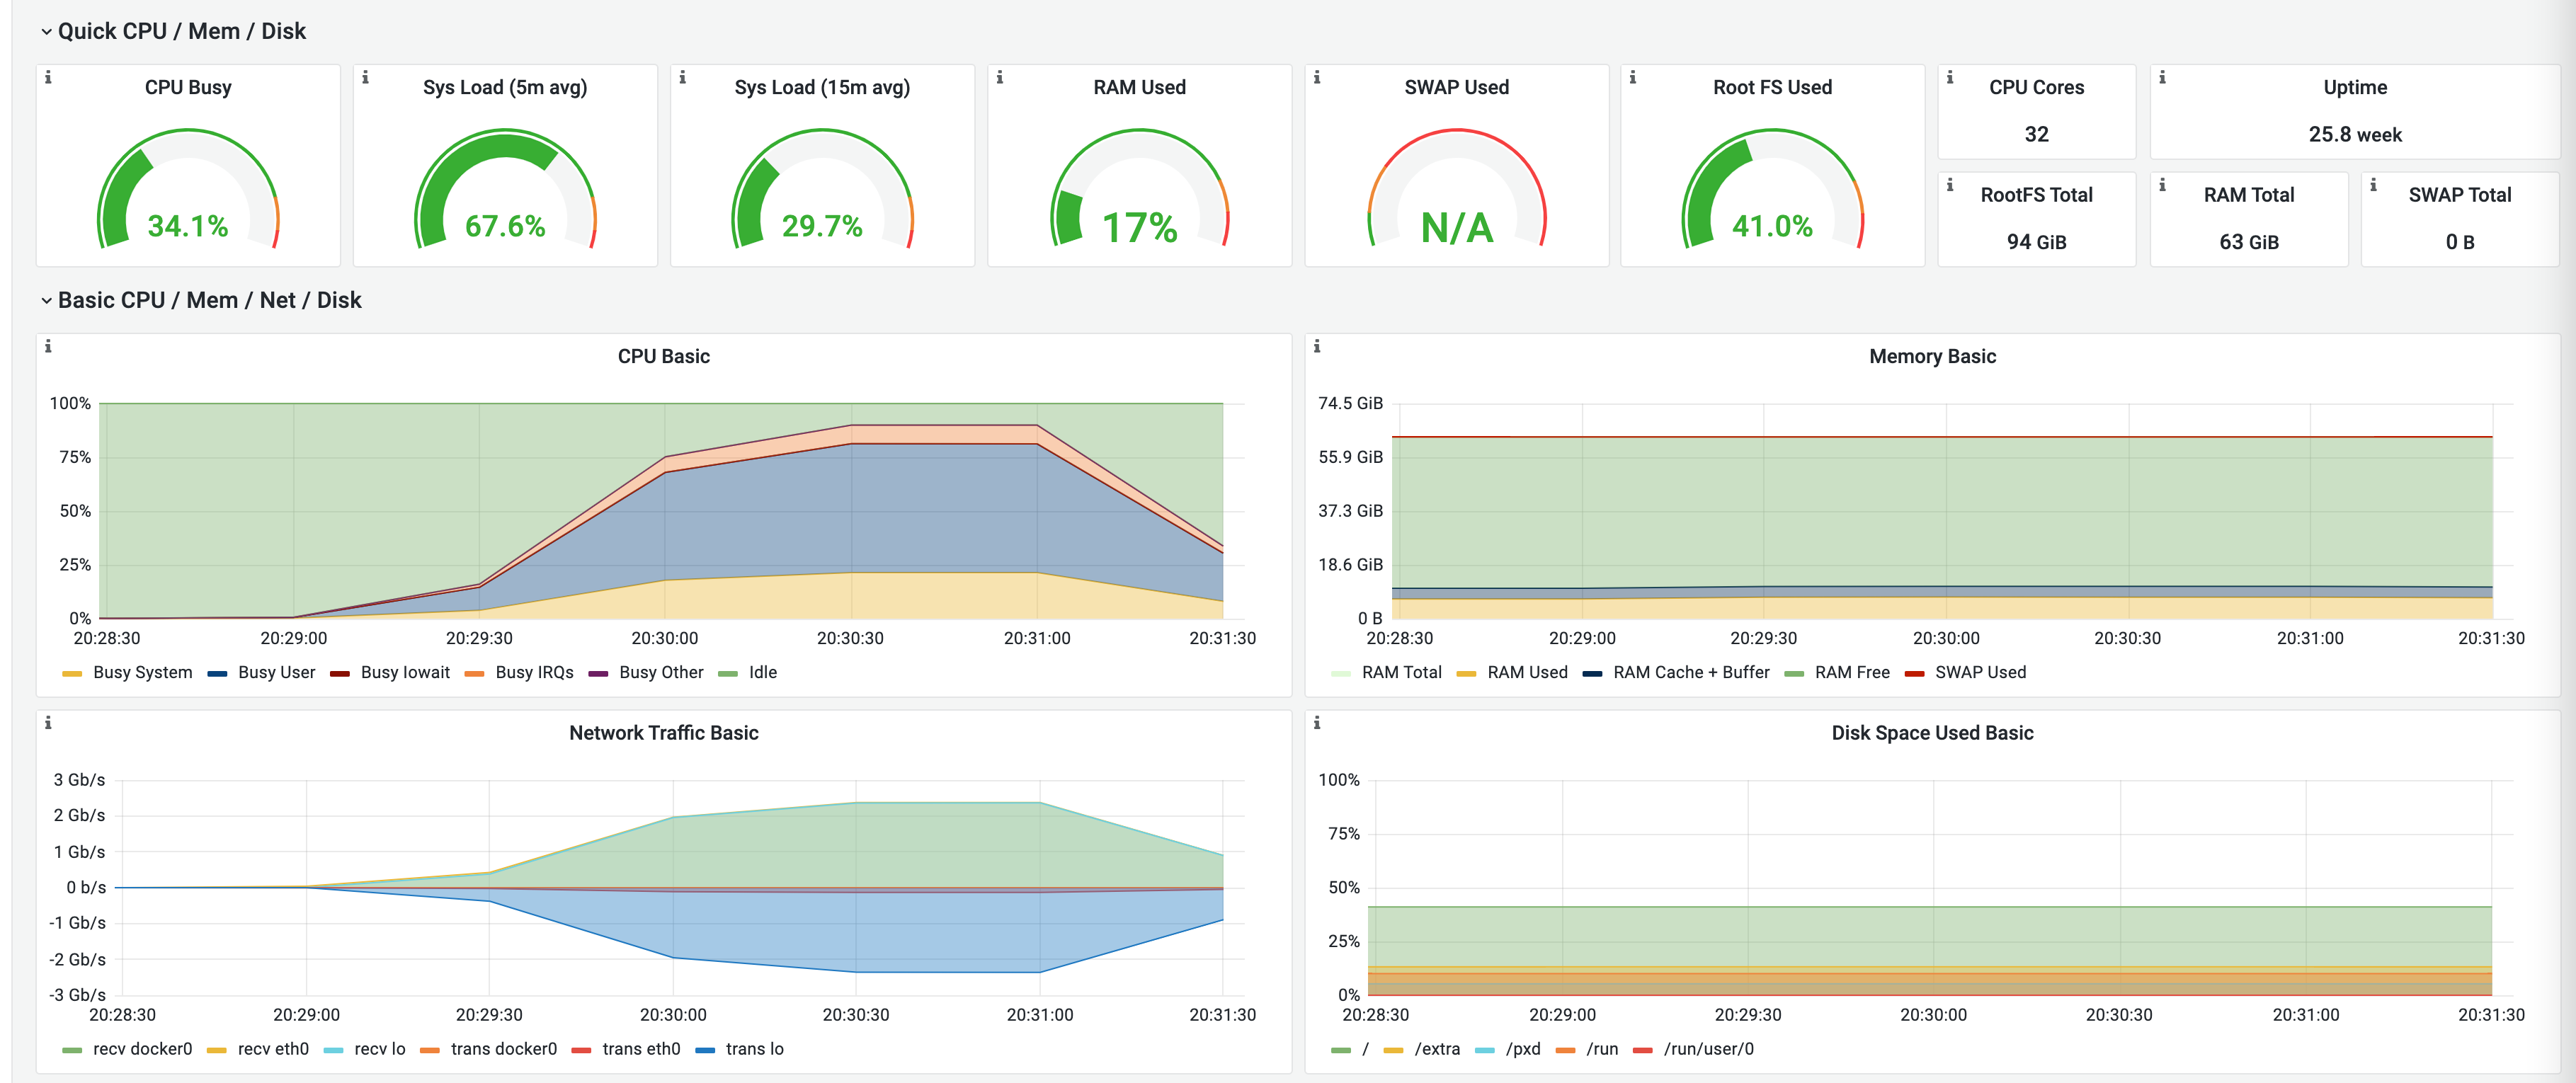
压测 中 Proxy 所在服务器负载
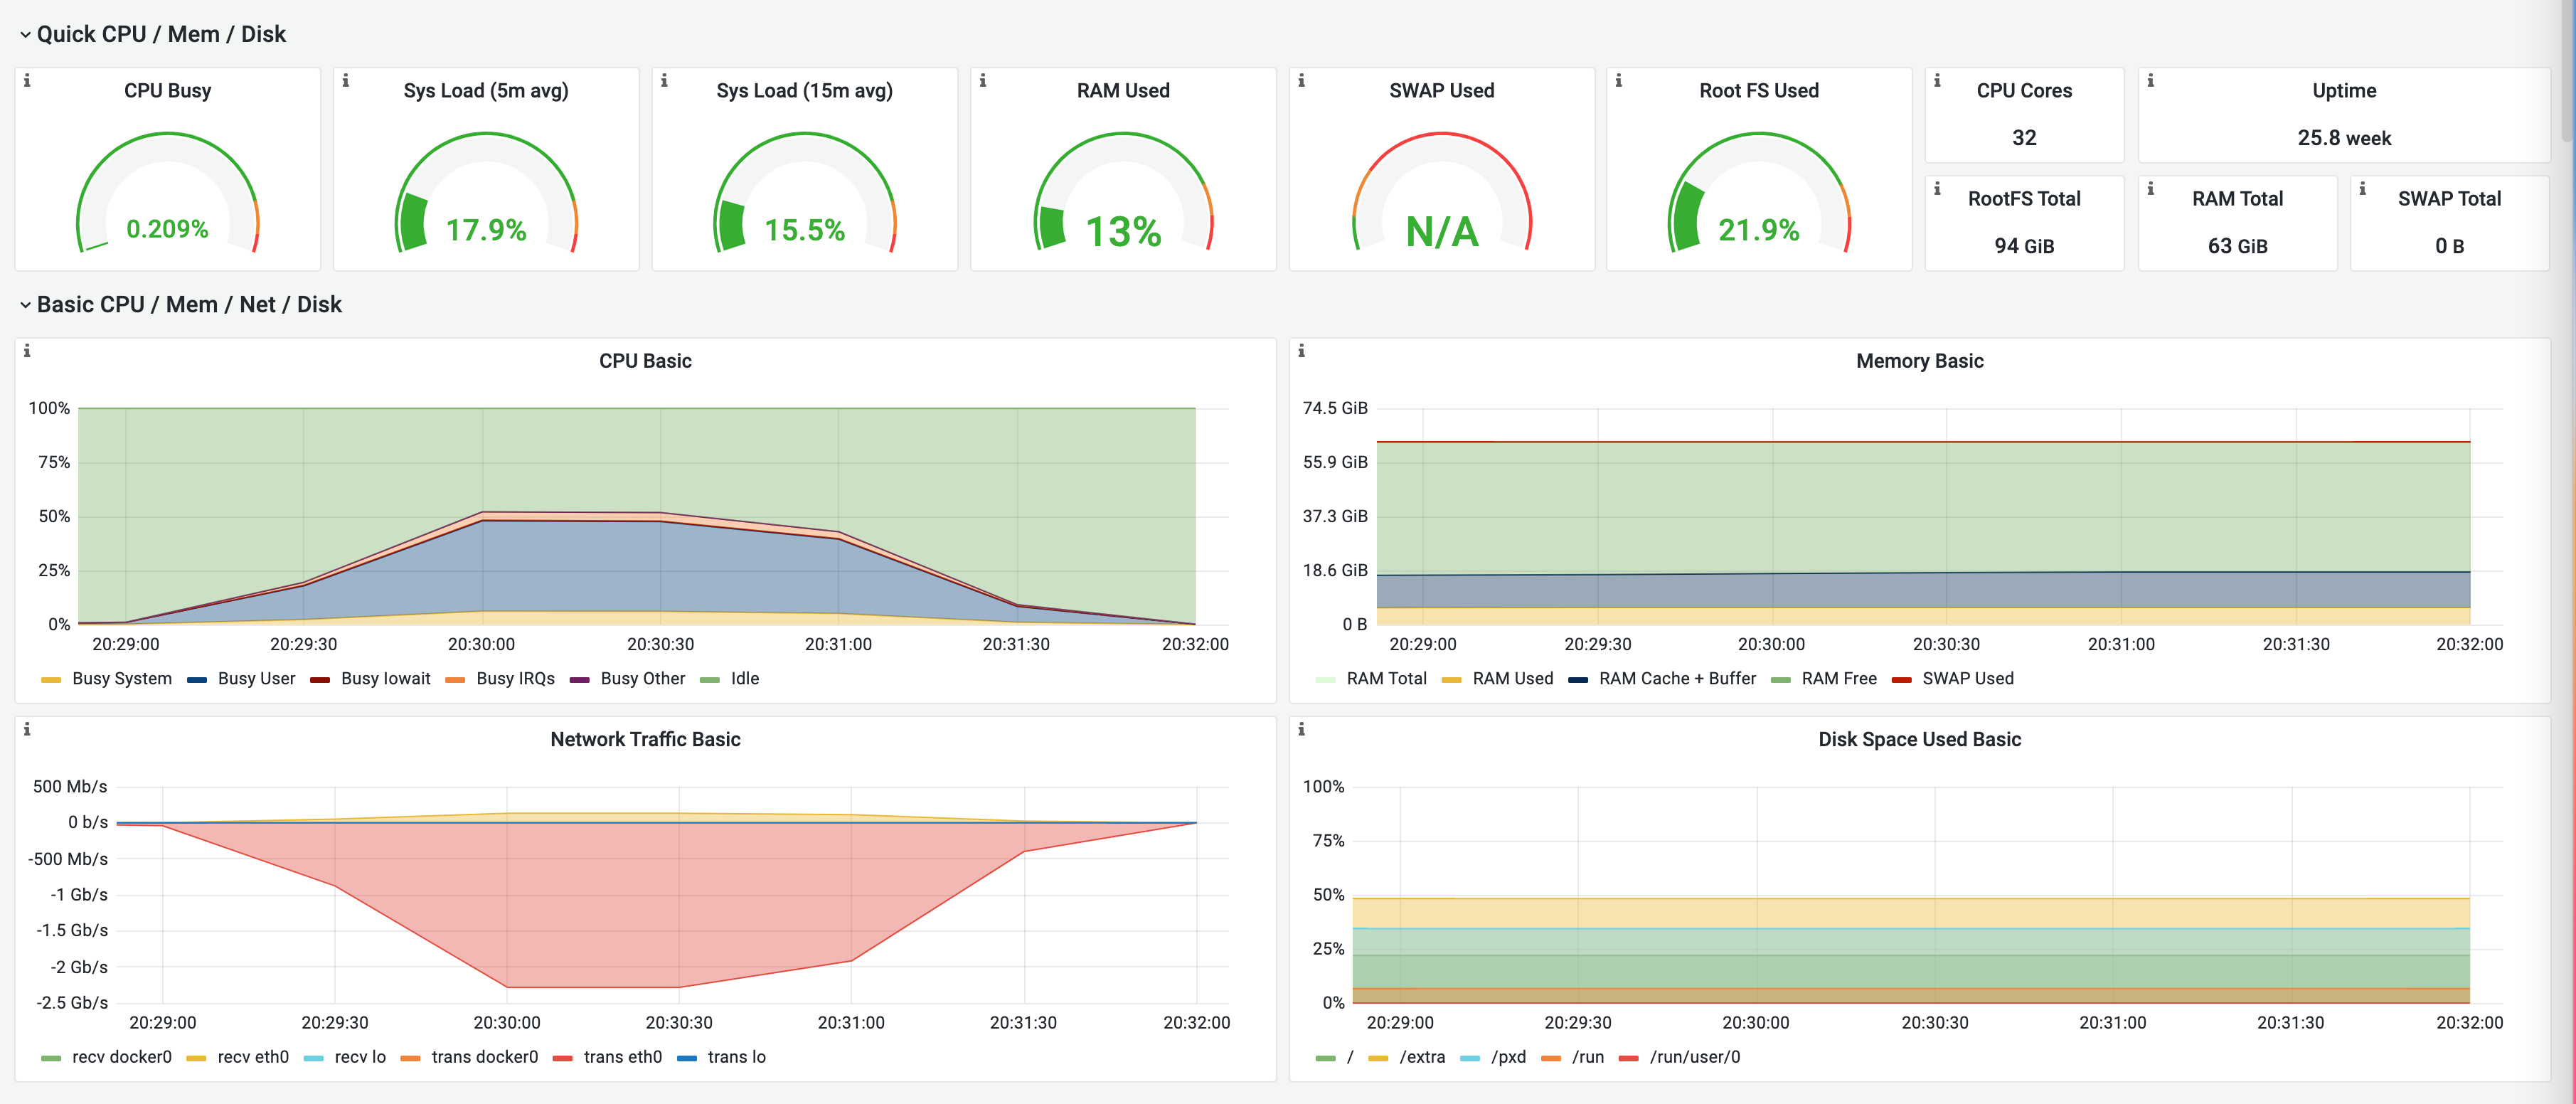
压测 中 DB 所在服务器负载
验证结论
通过使用 sysbench 压测 DB & Proxy 得到 ShardingSphere-Proxy 透传 MySQL 的损耗大概在 42%,响应时间提升 60% 左右,整体在一个数量级上。